
There are several reasons why you may need to open the Google Chrome Dev Tools, but this guide article will walk you through the steps that will help you gather enough details to help Evident's support team answer you're questions more effectively.
The first step in gathering details will be to open the developer tools to view the console. In order to do this you'll need to follow these steps:
- Open Google Chrome
- Navigate to the product and environment you want to collect information on (i.e. customer.evidentid.com, demo.evidentid.com, insurance.evidentid.com, or demo-insurance.evidentid.com)
- To open the developer tools in Google Chrome, open the Chrome Menu in the upper-right-hand corner of the browser window and select More Tools > Developer Tools. You can also use Option + ⌘ + J (on macOS), or Shift + CTRL + J (on Windows/Linux).

- Next you'll want to select the "Console" tab as shown

From the console tab you should be able to see if any error messages are being thrown. These are the details you should be providing to the Evident Support team.
The second step in gathering details will be to navigate to the network tab in the Google chrome developer tools. In order to do this you'll need to follow these steps:
- Open the Developer tools using the instructions listed above
- Once the developer tools are open you'll need to navigate to the "Network" tab
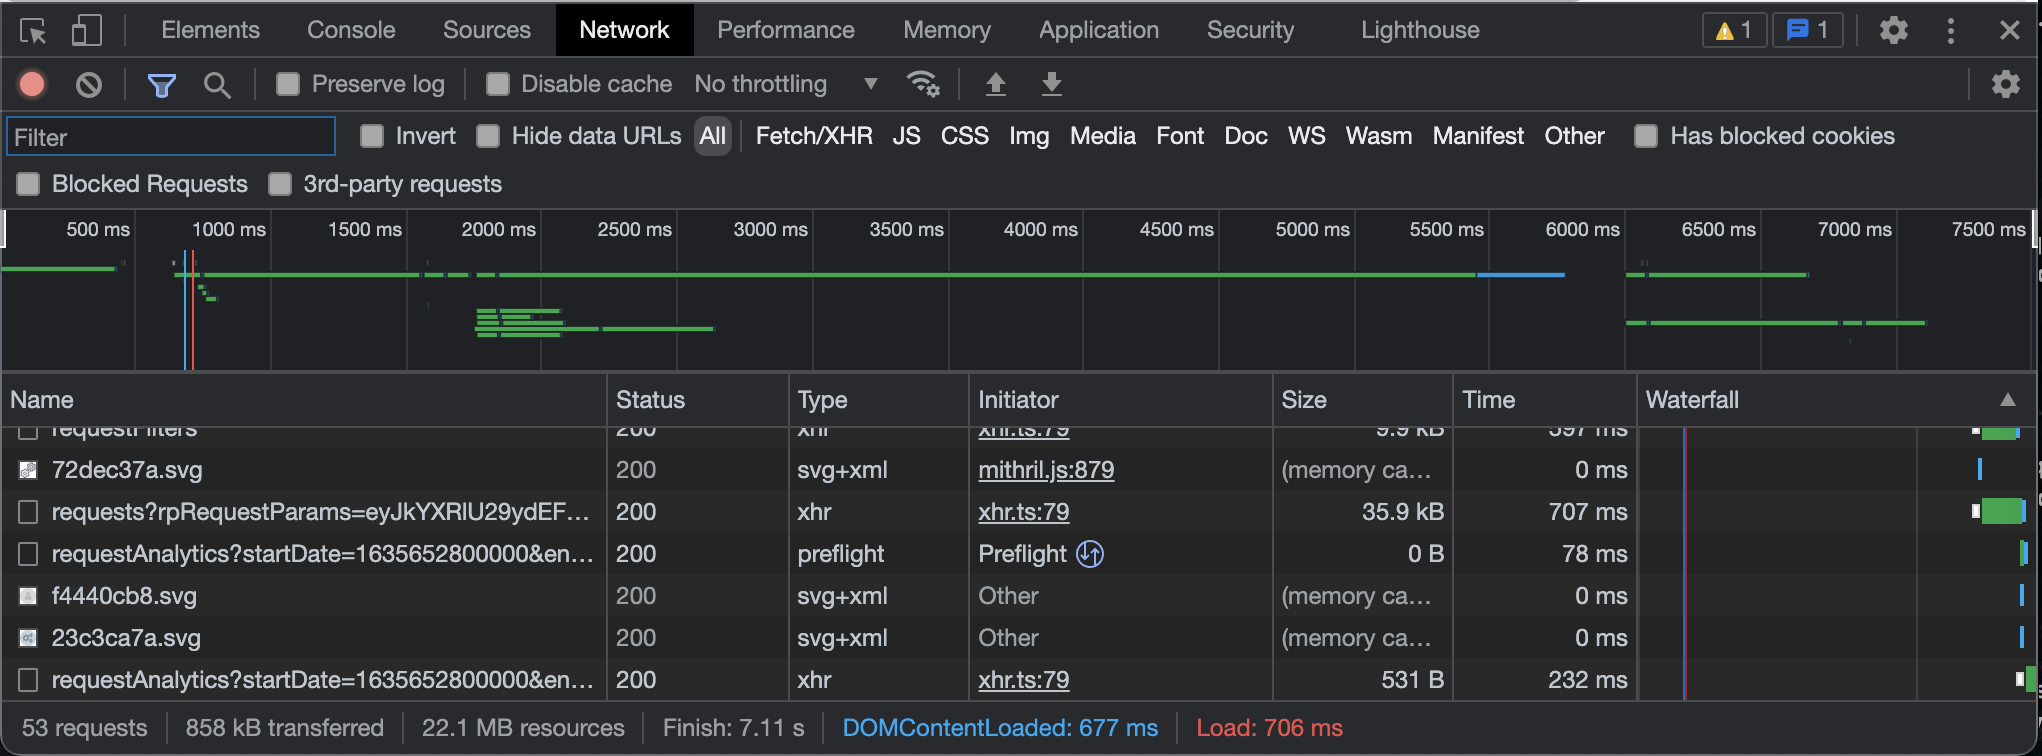
You can use the network tab to see if a certain API call is taking too long to gather information as well as see the total amount of time a page took to load. Both of these details can be very helpful to the Evident support team.