
Overview: Occasionally you might have the need to view the developer tools in your browser to see if an error occurred. This guide will walk you through the process of opening the dev tools/console in some of the most commonly used browsers.
For most browsers you'll be able to open the dev tools by simple clicking your function button + F12. For more specific instructions for each browser you can follow the guides below.
Google Chrome
To open the developer console in Google Chrome, open the Chrome Menu in the upper-right-hand corner of the browser window and select More Tools > Developer Tools. You can also use the shortcut Option + ⌘ + J (on macOS), or Shift + CTRL + J (on Windows/Linux).

The console will either open up within your existing Chrome window, or in a new window. You may have to select the Console tab.

Microsoft Edge
To open the developer console in Microsoft Edge, open the Edge Menu in the upper-right-hand corner of the browser window and select F12 Developer Tools. You can also press F12 to open it.

The console will either open up within your existing Edge window, or in a new window.
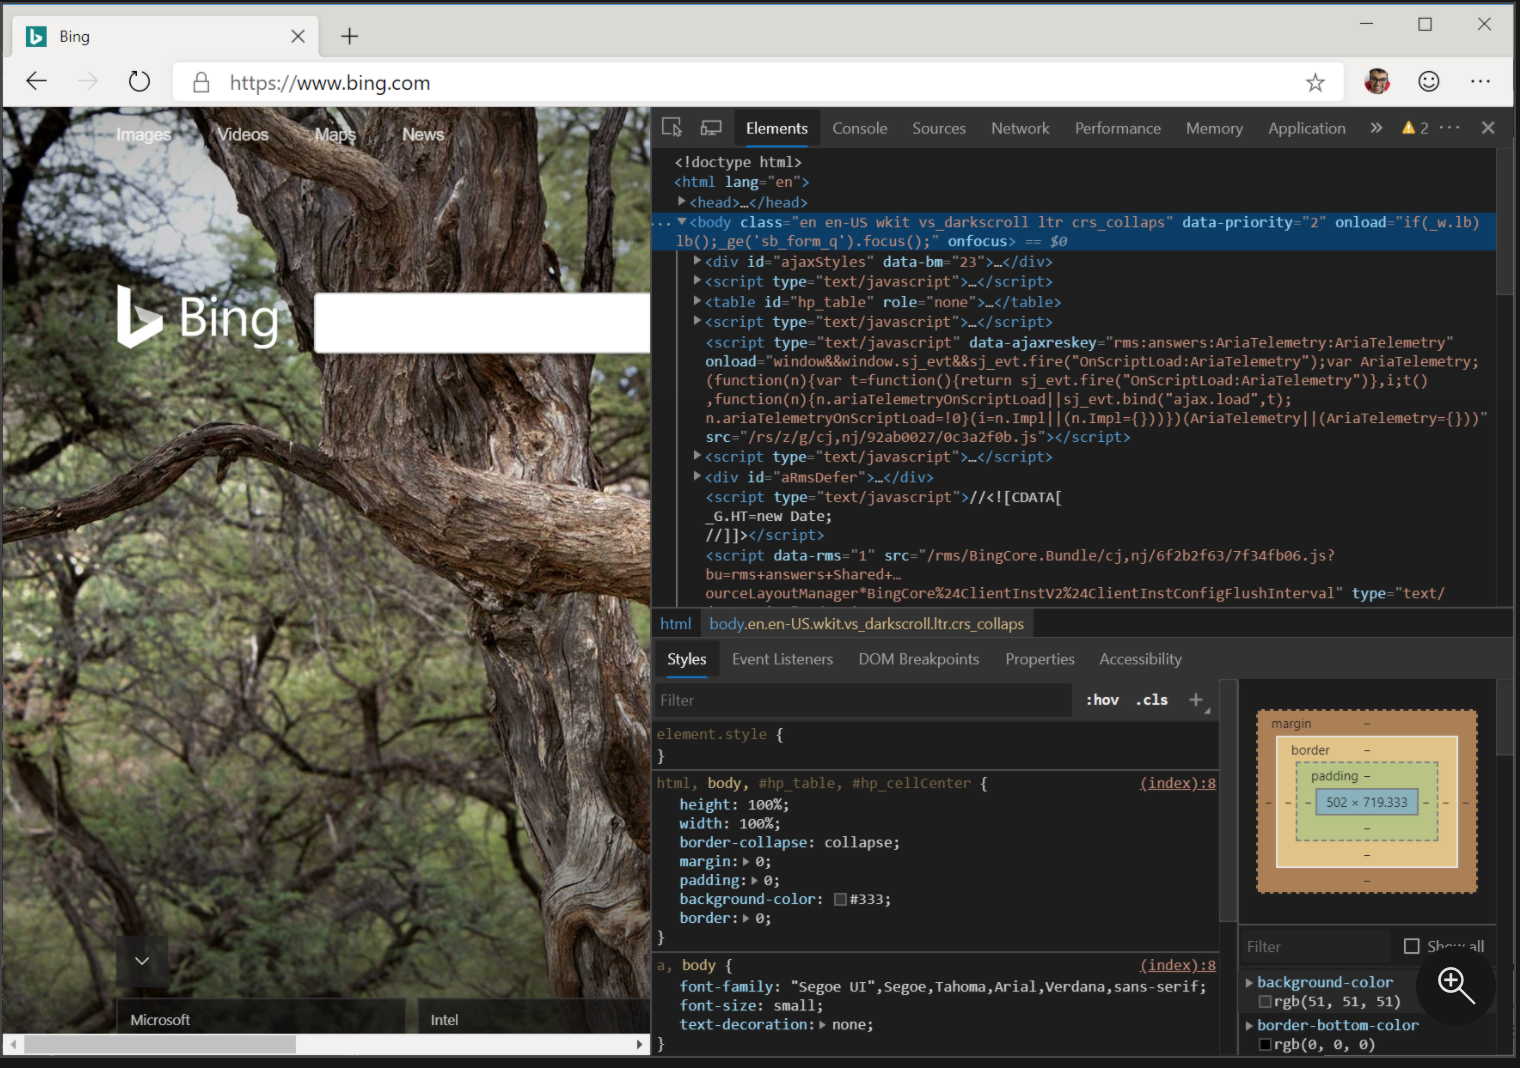
You will need to select the Console tab.

Mozilla Firefox
To open the developer console in Firefox, click on the Firefox Menu in the upper-right-hand corner of the browser and select Web Developer.

From there, select Browser Console.
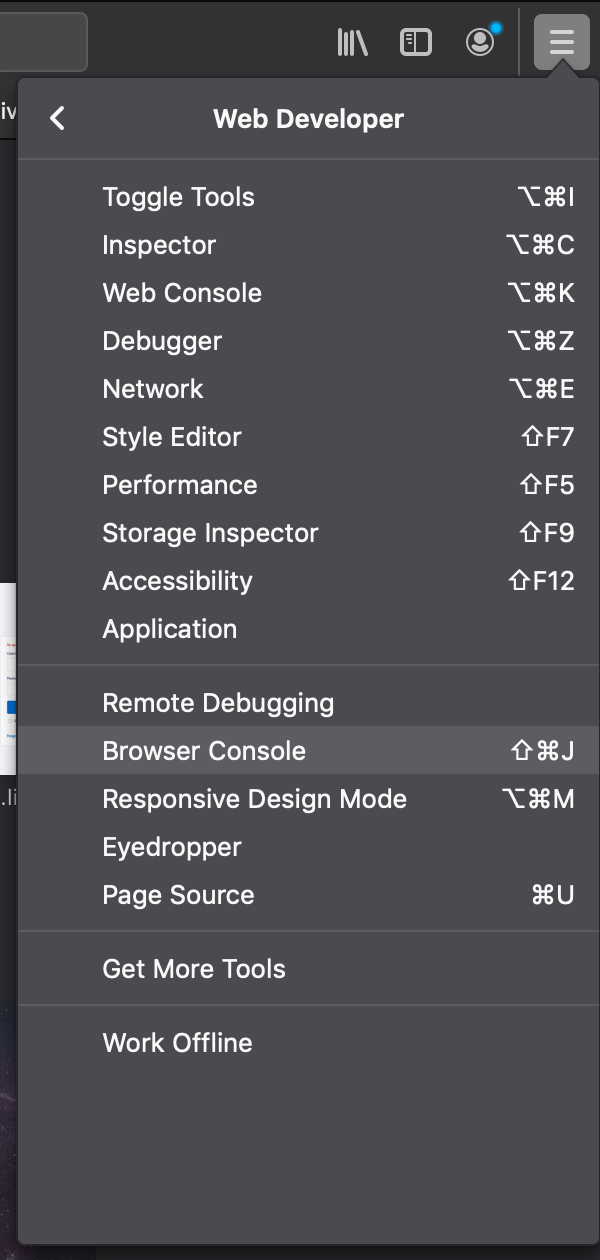
The Browser console will open in a new window.

You can also use the shortcut Shift + ⌘ + J (on macOS) or Shift + CTRL + J (on Windows/Linux).
Apple Safari
Before you can access the developer console in Safari, you first need to enable the Developer Menu. To do that, go into Safari's preferences (Safari Menu > Preferences) and select the Advanced Tab.

Once that menu is enabled, you will find the developer console by clicking on Develop > Show Javascript Console. You can also use the shortcut Option + ⌘ + C.

The console will either open up within your existing Safari window, or in a new window. It will automatically select the Console tab.
